


Animated Sport Results I.
Fencing, Handball and Soccer results by using the same chart type
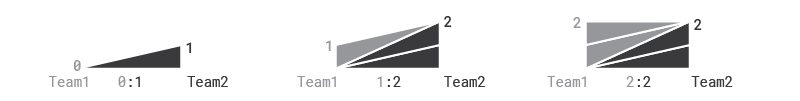
This "stacked triangles" data visualization gives a recap of the match and shows the order in which teams scored. This works for several sport disciplines when teams or individuals win by scoring goals or points. When I used this chart type for different sport events, I always added small modifications to make sure it works with the actual sport discipline.
Handball – A team can score 20-30 goals in a match and the two halves can look very different. I divided the chart by half time and the Norwegian team helped showing the strength of this chart type by turning around this gold medal match in the second half.
Ice Hockey – Sometimes one team is winning the match easily, crushing the other team. As the losing team is falling behind, you can observe that only one side of the visualization is building up, highlighting the difference clearly.


Fortunately, most matches are not so one-sided and the losing party can even make a come back after falling behind by many points. The slope shows which team is currently winning and by how much.


Soccer animations will always seem quite simple compared to a handball match because of the low number of goals (0-3 goals per team is pretty common).


Penalties - When teams score the same number of goals during the match, penalties (soccer) or shootouts (hockey) can happen. I added triangles on the sides to represent these penalty scores. A penalty can be a score or a miss, so basically, it's a binary true/false value. Since 0-0 is not a rare result in soccer, the penalty triangles create can big unused gap showing the missing goals. See the 3rd image for an example of this case.


Fencing – In most sports teams can't score in the exact same second. There is always a clear order who scored first. Fencing is an exception to that rule, as the two opponents can hit one another at the same moment in which case both get a point at the same time in the animation as well.
The "stacked triangles" were inspired by Basketball Tower Charts (Andrew Garcia Phillips, Chartball.com)
Get a sneak peek into my latest projects on twitter: @szucsi


